Dashboard
The dashboard is Memida’s central information board. It presents all important information in a clear way. A daily glance at the dashboard is enough to stay informed about all upcoming tasks and changes.
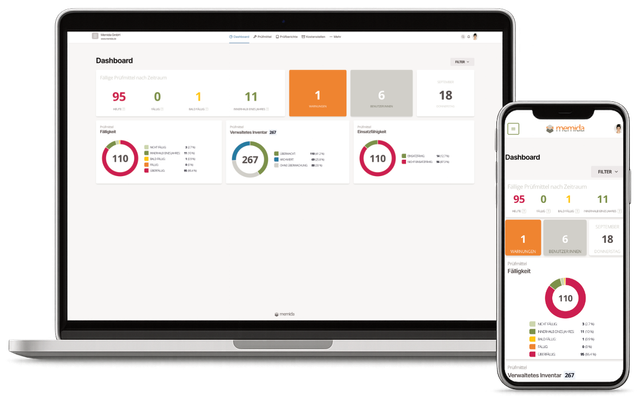
Fig. 1: Dashboard content
Dashboard content
The dashboard is divided into several visual sections. Each section shows the current state at the time you open the dashboard.
Due inspection equipment by time period
This section shows four numbers that represent how many inspection devices are due in different time frames. The far-left number shows the devices that are currently due. The second number from the left indicates how many inspection devices become due within the next 7 days. The third number from the left shows how many inspection devices are due in the next 1–4 weeks. The number on the far right represents the devices that fall due within the next year.
As soon as a value greater than 0 is displayed, you can click the section. The link then takes you directly to the affected inspection device or to a list of the affected devices.
Warnings
The warnings section shows the number of inspection devices that require immediate action.
Users
The users section shows the total number of user accounts in the system. Clicking the number takes you to the users area.
Calendar day
This box displays today’s day and month.
Due status
This donut chart displays inspection devices by their due status.
The legend shows the meaning of the colors, the number of devices, and the percentage share.
Clicking a value in the legend opens the associated list.
Managed inventory
This donut chart shows inspection devices by monitoring state. In Memida, inspection devices can have the following monitoring states:
- monitored
- archived
- not monitored
Clicking a value in the legend opens the associated list.
Operational readiness
This donut chart shows inspection devices by operational readiness. The legend shows the meaning of the colors, the number of devices, and the percentage share. An inspection device can have two readiness states:
- not ready for use
- ready for use
Clicking a value in the legend opens the associated list.
Filters
You can freely choose filters to tailor the dashboard to your needs. The filters can be grouped as follows:
- Companies (all companies you have created; visible to admins only)
- Cost centers (all cost centers assigned to you)
Clicking a filter (1) updates the underlying data on the dashboard (2) accordingly.
Tip: Check whether you have an active filter (3). Filters remain active until you deactivate them again.
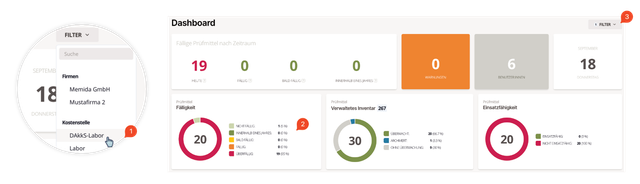
Fig. 2: Dashboard filters